
Motivation
If you trace back a dollar spent on, say, a robot all the way down its supply chain, how much is paid in compensation for value added by capital?
When the answer is “100%”, we’ll have closed the loop. The machines will then be self-sufficient, to use the term in Ajeya Cotra’s post from the other day. No one will need to be employed to make a robot of this sort from its parts, or any part of the robot from the parts of the parts. To get poetic about it, you might say that we’ll have made a new form of life. It might be good to know when we’re close to making such a machine, not only because of the massive economic effects it would have if it’s broadly useful but, as Cotra emphasizes, because of the risks it could pose if it’s instructed to do damage or if it seeks to and gets out of control.
The point of this short post is to introduce people thinking about “self-sufficient” machines to the idea of a machine’s network-adjusted private capital share (NAPCS), a quantity that formally answers the question above. At the end I also present a graph of the NAPCS of computer and electronic products over time. It’s 40%, and as flat as a board.1
Network-adjusted factor shares
Suppose each industry produces one output good. For each dollar a firm in that industry gets in revenue from selling its output good in a given year,
some is profit, received by the owners of the firm (i.e. the firm’s capital);
some is spent on labor at the firm;
some is taxed; and
some is spent on intermediate inputs: the outputs of other industries (or the same industry) used by the firm to produce its own output.
Let αK be the column vector of profit margins by industry, i.e. how much of each dollar of revenue is paid directly to firm owners (#1), and αL be the vector recording what fraction of revenues are paid directly to firm employees.
The US Bureau of Economic Analysis (BEA) puts out an annual direct requirements matrix, which I’ll call D. The matrix is 71 × 71, corresponding to a partition of the firms in the country into 71 industries. Column i records, for each dollar of revenue received by industry i, what fraction was spent on intermediate inputs from industry j (for row j). The columns almost always sum to less than one, because #1–3 above are typically positive.
Let v be the unit column vector with a “1” in the “robot” entry and zeroes elsewhere. Dv is the vector of first-order inputs: for each dollar spent on robots, how much is received by each intermediate industry. Likewise, D(Dv) = D2v is the vector of inputs to the inputs, and so on. The vector of total requirements for robots is v + Dv + D2v + D3v + … = (I – D)-1v.
The first v accounts for the fact that the whole dollar is received by the robot industry before parts of it circulate elsewhere. The other terms account for the fact that parts of the dollar are also received by other industries one, two, three, … steps down the line. At step n, the vector of industry revenues is “Dnv”, and its payments to capital and labor are αK · Dnv and αL · Dnv respectively. So:
The network-adjusted capital share (NACS) for robots is then αK · (I – D)-1v.
The network-adjusted labor share (NALS) is likewise αL · (I – D)-1v.
This gives us how much of the dollar is ultimately paid out to each factor across the chain.
The network-adjusted private capital share
For an industry i, NACSi + NALSi is typically less than 1 due to taxes. We presumably don’t want to say that a human-free supply chain is only partially automated due to taxes, or more generally let our measure of the automatedness of a supply chain change arbitrarily with the tax code. So we might take as a measure of i’s “self-replicability” what I’ll call its network-adjusted private capital share (NAPCSi): NACSi / (NACSi + NALSi).
Insofar as the public sector is providing goods necessary for good i to “self-replicate”—e.g. roads connecting the factories making the various parts, or legal rulings in case the automated firms have disputes—we would ideally account for these separately, and say that i is self-replicating only once these public-sector goods have been automated. But putting that (maybe significant) issue aside, if some good has a NAPCS of 1, everyone in the world could die, and it could go on multiplying.
Note that NAPCSi doesn’t capture where each dollar spent on good i this year “ultimately went” to build the unit purchased this year. It captures something that is in some ways more relevant to the question of self-replicability.
In the absence of new investment by the firms in industry i, to prepare for the production of new kinds of goods, NAPCSi would capture exactly what we want: not the current “factor composition” of good i, but where each dollar spent on good i would go given today’s supply chain. For example, if it takes 2 years to build a robot, and last year we couldn’t automate some parts of the process but now we can, the robot NAPCS today would be 1 even though the robots sold today all had labor input.
On the other hand, it should be noted that insofar as industry i spends this year to develop infrastructure unrelated to producing the goods it is selling this year, NAPCSi can come apart from the current self-replicability of this year’s variety of good i. The statistical agencies do try to put only expenditures on current production in the direct requirements matrix, assigning reinvested profits to the capital income category; but this seems challenging, since many expenditures facilitate both today’s production and tomorrow’s.
NAPCS series
“Robots” isn’t one of the 71 industry categories, but here is a series of the NAPCS for “computer and electronic products”. It seems to have hovered around 0.4 for decades, roughly the same as the capital share for the economy as a whole, with no trend (at least up to 2023).
I’ve calculated it using the data from the BEA and using data from the OECD, which accounts for supply chains that cross borders (at least within the OECD). Where the OECD data has missing entries, I filled it in with values that would minimize the NAPCS and with values that would maximize it. More information on reconstructing the series is in the footnote.2
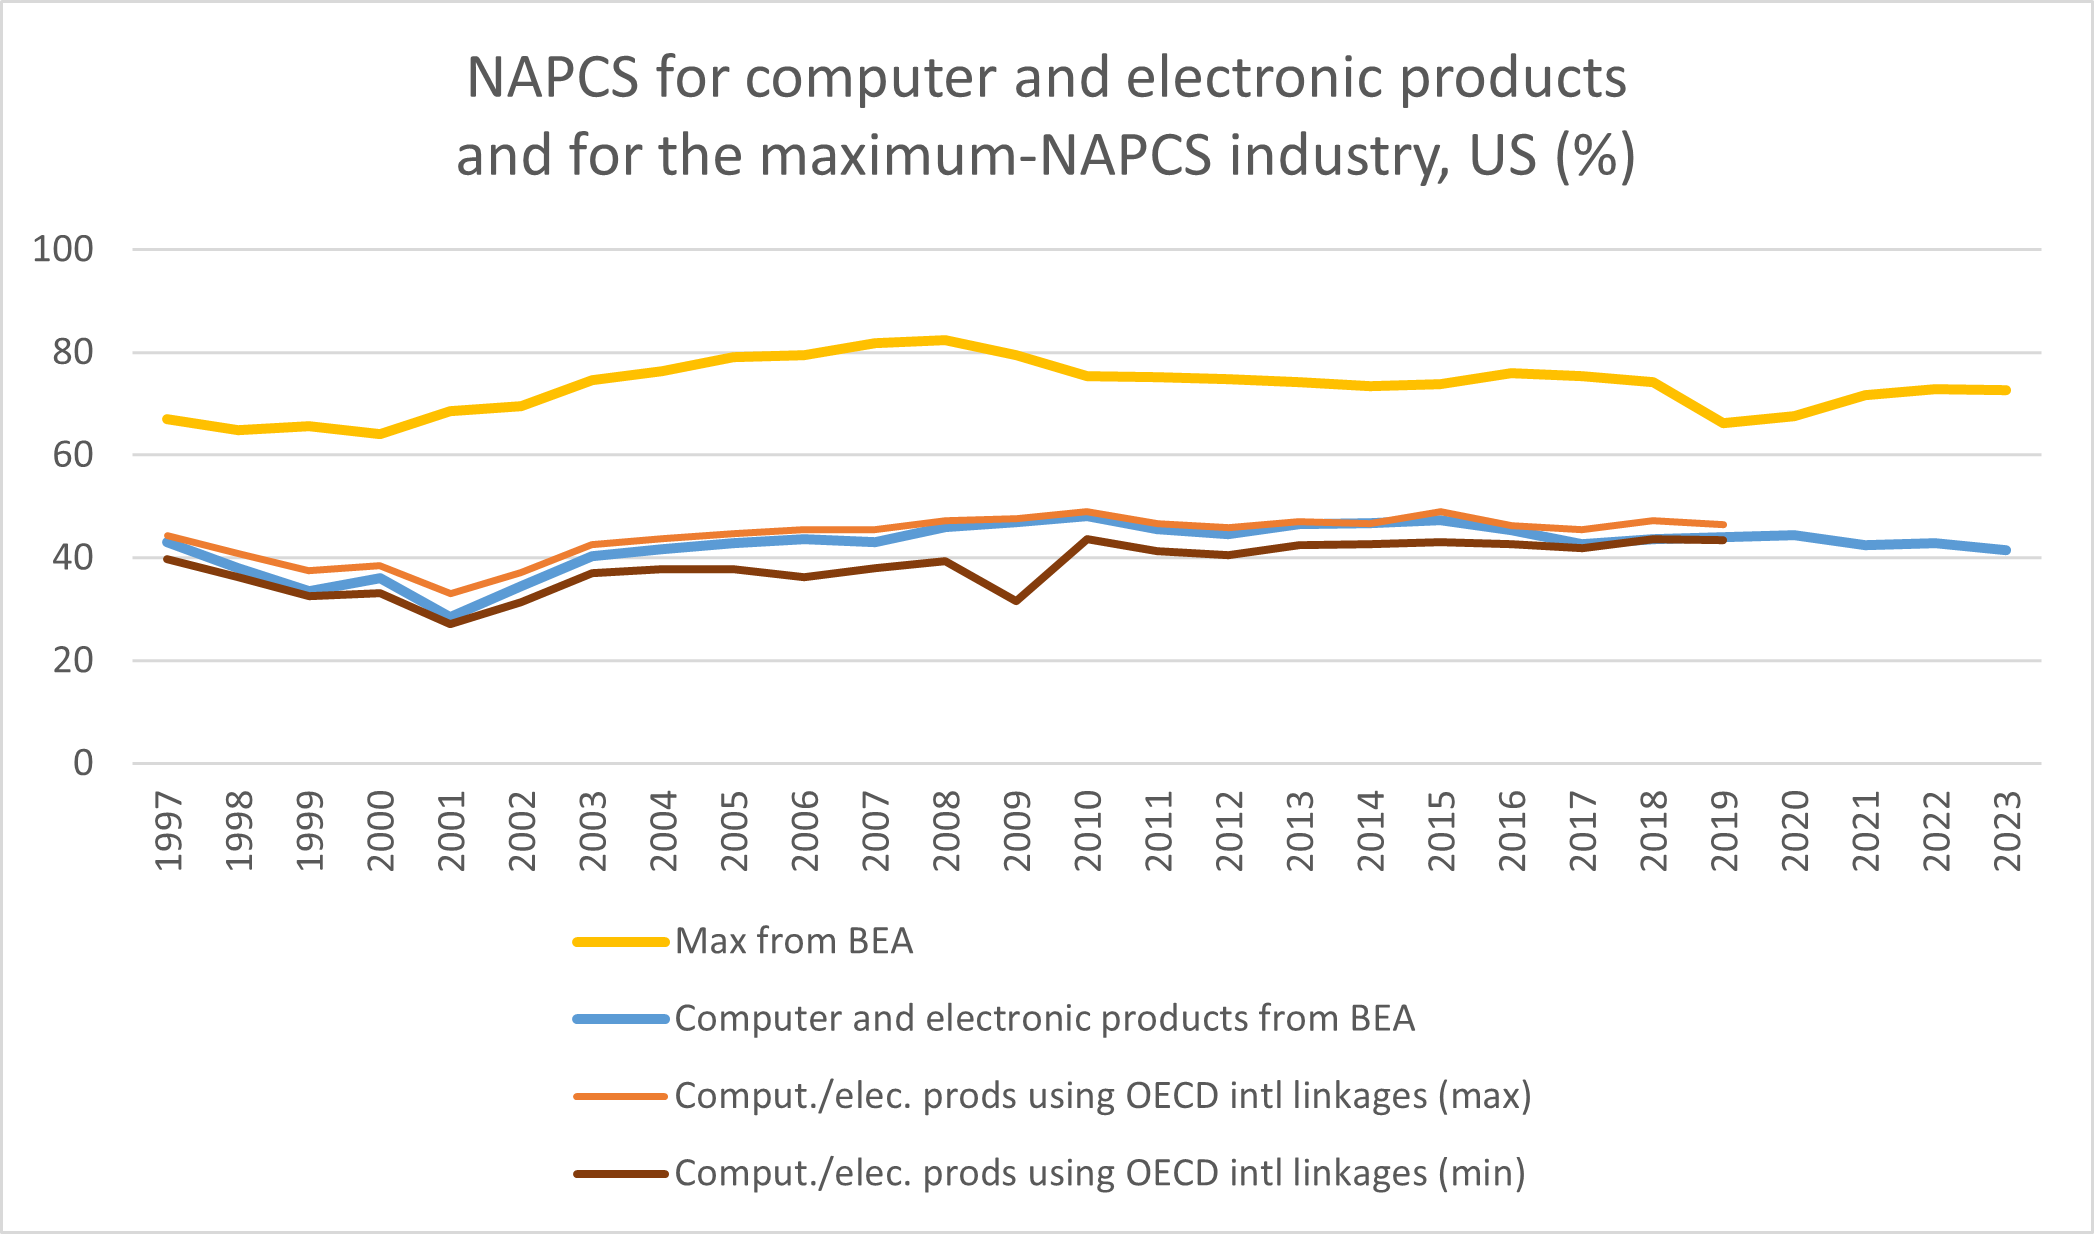
I also thought it might be interesting to look at the NAPCS of the maximal-NAPCS industry in each year. This is the series in yellow. The thought was that, in some sense, it tracks how close we are to having some good with a fully automated supply chain. But the highest-NAPCS good is generally crude oil, reflecting not automation but the fact that most revenue goes directly to the natural resource owner. That is, most of the value of a barrel of crude oil “comes from capital”, in that natural resources like oil are themselves accounted as capital; but oil is far from pumping itself out of the ground.
So on the NAPCS measure, at least, it seems we’re far from the first unit of self-replicating capital.
I hope it’s of interest, but I made it a year ago and it’s possible I missed some nuances about the data that went into it, so I would encourage people to double-check it (and get it up to date) before taking it as gospel. I hope to check and update the numbers soon, but I was worried I might never get around to it; so for now, this is what I had on hand—I figured I’d put it out today, while people were thinking about Ajeya’s post.
Network-adjusted private capital shares from the BEA are constructed by multiplying a row vector of industry-level private capital shares, computed from the annual “Use” tables (titled “The Use of Commodities by Industries, After Redefinitions (Producers’ Prices) - Summary”), by the matrix of total requirements, from the annual tables titled “Commodity-by-Commodity Total Requirements, After Redefinitions - Summary”. Raw data, and code for generating the two BEA time series above, can be found here. Data from the OECD treats each (country, industry) separately, so that imports of a given good from a given country are assigned the factor shares associated with that (country, industry). The matrices of total requirements are calculated by taking the Leontief inverses of the direct requirements tables. Network-adjusted factor shares are then calculated as from the BEA data above. Because data on the capital or labor share for a given (country, industry, year) is sometimes missing, I construct two series for each factor share: one in which the missing data point is maximal across countries for that (industry, year) for which data is provided, and one for which it is minimal. Note that in some non-US countries a significant share of labor income from very small businesses is accounted as capital income. The OECD series are presented alongside the BEA data, despite being many years out of date, to confirm that the BEA data’s less sophisticated accounting for international linkages is not masking an important trend in the data. Raw data, instructions for downloading it, and code for generating the OECD time series above can be found here. The spreadsheet with the final data and graph is here.
This is a very interesting approach to quantifying the extent of automation in the robotics+AI supply chain. I am confused by something though.
If I'm understanding correctly, the idea is that money spent on intermediates stays within the system, and it can leave by three routes: taxes, employee compensation, and profit. Then we can compare how much leaves as employee compensation vs how much leaves as profit. (By the way, I'm amazed that the necessary data exists to calculate this number.)
But what if the companies are choosing to invest rather than make a profit? For example, OpenAI and Anthropic are losing money largely because they keep investing in upcoming models. If (in a hypothetical extreme case) all the relevant companies were like that, then wouldn't NAPCS come out to 0, not matter how automated they might be? If so, then NAPCS is affected not just by the degree of automation but also whether capital has chosen to "cash out" in the form of profits vs reinvest the revenue.
(Sorry if I'm making a basic misunderstanding.)